Practical Data Analytics - Troubleshoot Your IIS Web App in Seconds with Kusto

How many of you find yourself in tech'ish conversations when the
topic shifts to doing something useful with all the data running
out of your company's data-tap. In my experience those conversations quickly shift to how
data analytics will - one day - allow for predictive detection of anomalies, robotic
responses, etc. If you are like me it surely sounds like a cool and exciting
future that we all aspire to make real. So why not get started today?
I believe to start
that journey we need to find practical ways to apply data analytics to the platforms we use right now, with the data we have right now, and use it to make a tangible impact to the
job we do right now. So, let me show you HOW with a quick dive into using the
Microsoft Kusto data platform.
Kusto is a time series data platform that Microsoft developed in-house for
managing their own log data. Encouraged by success Microsoft turned it into an Azure service we can all
use for applications hosted on-prim or in a cloud. Kusto shows up in several Azure services as the underpinning data logging platform
... you'll find it in Azure Log Analytics, Azure Application Insights, Azure
Sentinel, Azure Data Explorer, etc. If you understand the concept on other
platforms like Elastic and Splunk you can make a simple equivalency if its helpful. A good
description of the Kusto syntax is provided by Microsoft ...
The syntax of the tabular expression statement has tabular data flow from one tabular query operator to another, starting with data source (e.g. a table in a database, or an operator that produces data) and then flowing through a set of data transformation operators that are bound together through the use of the pipe (|) delimiter. link
For the sake of this discussion we'll be focusing on using the Azure Log
Analytics platform. Log Analytics enables you to deploy log ingestion agents on your servers or send direct log streams to a REST API. I'll be using a demo environment that Microsoft maintains
and makes accessible to the world [Demo Log Analytics Link]. You'll need to sign-up for access to the Azure Portal which is easy.
Once you sign-in you'll be taken to the query interface in your browser. I
highly recommend you use a browser based on Chrome.

The query editor is laid out with the left hand panel showing you tables that are present in the workspace. For this demo I'll use the
W3IISLog table that is under the LogManagement node. Feel free to navigate
around to see the attributes of that table.
So let's 1st find out how many Computers are sending their IIS logs to this
workspace over the last 2 days.
W3CIISLog
| where TimeGenerated <= ago(2d)
| summarize by Computer
| sort by Computer asc
I suggest you type this query in v/s cut and paste because you'll get to see
the IntelliCode prompts that help you structure the query. This query will use
the W3CIISLog table and look for rows of data created over the past 2 days
then summarize it by Computer name and sort by name in ascending
order. When I ran this query 928 rows were returned which means we
have fleet of 928 servers running IIS and sending logs.
TIP: For those that want to use the F5 shortcut to select and run their query ... DON'T DO IT! Simply highlight your query and use the SHIFT+ENTER shortcut.
Now lets get a feel for the overall health of our IIS fleet.
W3CIISLog
| where TimeGenerated <= ago(2d)
| summarize count() by scStatus
| sort by count_ desc
So we see in the data that the HTTP status code of 200 is the most
frequent response code which is good.

Now lets visualize the data in a quick pie chart by adding the render
command.
W3CIISLog
| where TimeGenerated <= ago(2d)
| summarize count() by scStatus
| sort by count_ desc
| render piechart

Now we can clearly see that about 67% of the web requests to our web servers are good
and around 18% are failing with HTTP 500 errors. Let's now take a look and see
which servers are generating the 500 errors.
W3CIISLog
| where TimeGenerated <= ago(2d)
| where scStatus == 500
| summarize count() by Computer
| order by count_ desc
The result set returns over 900 rows that are ordered by highest to
lowest count. To help us focus let's just look at the top ten. Replace the 'order
by' with 'top 10 by'.
W3CIISLog
| where TimeGenerated <= ago(2d)
| where scStatus == 500
| summarize count() by Computer
| top 10 by count_ desc
Let's render this as a pie chart.
W3CIISLog
| where TimeGenerated <= ago(2d)
| where scStatus == 500
| summarize count() by Computer
| top 10 by count_ desc
| render piechart
From our pie chart we can see that 2 servers in the 'contosohotels.com' name
space are generating over 50% of the bad requests in our IIS fleet. Probably not a good user experience!

Let's look at those 2 servers and find out which requests are linked to the
bad responses.
W3CIISLog
| where TimeGenerated <= ago(2d)
| where Computer in ("AppBE00.NA.contosohotels.com", "AppBE01.NA.contosohotels.com")
| where scStatus == 500
| summarize count() by Computer, csUriStem
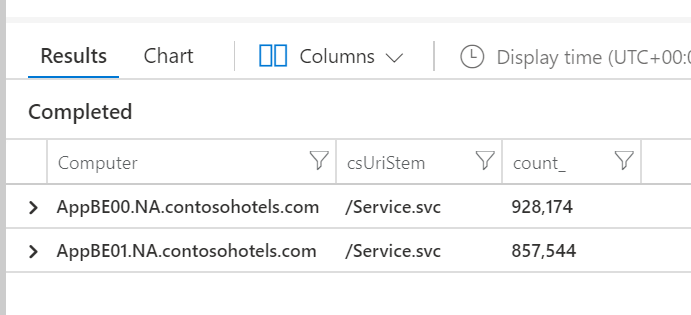
Well it looks like requests to '/Service.svc' are the ones that are failing so
it seems we should dive in there next. It may help to take 10 of the complete rows of
data to investigate other attributes to see if anything else jumps out.
W3CIISLog
| where TimeGenerated <= ago(2d)
| where Computer in ("AppBE00.NA.contosohotels.com", "AppBE01.NA.contosohotels.com")
| where scStatus == 500
| take 10

Based on the results above I can see that the page is being hosted in the
Default Web Site on the IIS server. At this point it would be a good idea to
look into the Event Logs on the Windows server to see what else might be
happening.
Event
| where TimeGenerated <= ago(2d)
| where Computer in ("AppBE00.NA.contosohotels.com", "AppBE01.NA.contosohotels.com")
| where EventLog contains "Application"
| where EventLevelName contains "Error"
| summarize by Computer, EventID, RenderedDescription
Unfortunately the servers in the demo Log Analytics workspace are not
configured to send the server event logs so we get back zero rows. To resolve
this we'd need to change the configuration of the workspace per this article. That's beyond the scope of this article and not something I have permission
to do in this workspace anyway.
There are additional ways to go much deeper than what is logged at the OS level by deploying Azure Application Insights to your IIS servers. It allows us to
click down into end-to-end transactions, see failed dependency calls (think
SQL, REST calls, etc), and client side exceptions. Again, this is beyond the
scope of this article yet I'll cover it in the not too distant future. Stay
tuned!


Well there you have it, you are now armed with practical data analytics that
will enable you to troubleshoot your IIS web applications in seconds at scale.
I do hope this will serve as a jumping off point for you and inspire you to
dive into the depths of your data!