Data Visualization with Grafana - Platform Quick Start

Hi folks. I'm sure we all get asks from our business stakeholder to create reports so they can see key performance indicators and make decisions. I don't know about you yet when I hear the word 'report' I cringe because it congers up several key words for me: long lead time, slow, more emails, out of date. Let's face it the 'report' is as out of date as faxing. So what can you do to drop the 'report' and deliver relevant dashboards, on demand, on the go?
Today I'd like to help you get started on your data visualization and dashboard journey with Grafana. We'll make use of several Azure services to get a serveless sandbox up and running quickly. Ready? Let's go!

Grafana
Grafana is an open source data visualization and dashboard platform developed in 2014 by Torkel Ödegaard so that he had a better way to visualize time series data across multiple data platforms. Fast forward 6 years and Grafana is now in its 7.0 release supporting over 30 data platforms with over 400 instances globally. It's easily accessible from laptops, tablets, and mobile devices which means every one of your stakeholders can see the same data instantly.
I've implemented this in the enterprise and have seen the following benefits:
- Easy to learn
- Works with traditional data stores like MySQL, MS SQL
- Native connectivity to Azure, AWS, GCP data stores
- Low Cost
- Portable dashboards on any device
Ready ... Let's Deploy
Let's dive into deploying Grafana into a serverless solution hosted on Azure. For this walk-through we'll use the following components:
- Azure Portal
- Azure Cloud Shell
- Azure Storage
- Azure Database for MySQL
- Azure Container Instances
If you don't have an Azure account you can sign-up here for a "free" account. If you are new to Azure and want to take a 101 level course you can try this one out for free.
Step 1 - Setting Up the Initial Environment via Azure Cloud Shell
We need to do a couple of basic setup steps to get going by creating a new Resource Group and the Container instance. I recommend using Google Chrome or the Microsoft Edge Chrome browser for best results.
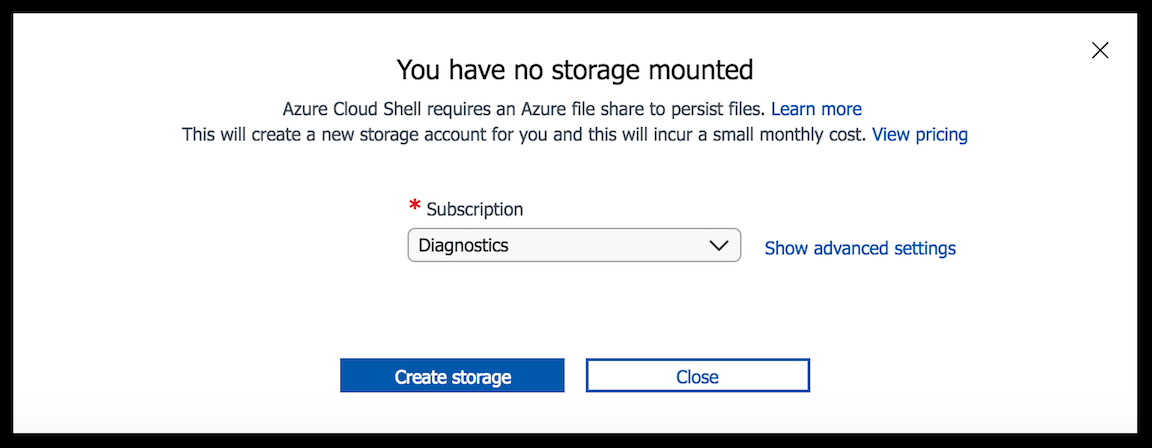
- Open up the Azure Cloud Shell at https://shell.azure.com/. If this is your 1st time into cloud shell it will prompt you that a storage mount point is needed. Just take the defaults.
- You'll need to select 'Bash' as the shell type. Once it loads you'll be setting at a command line like this.

- Now let's set a few variables up so we aren't having to retype over and over again.
resource_grp="GrafanaSbx"loc="southcentralus"
con_name="grafanasbxcont"
con_dns_name="[yourinitals]-grafanasbx"
con_image="grafana/grafana"
- Create the resource group
az group create --name $resource_grp --location $loc
- Create the new container instance for Grafana.
az container create --resource-group $resource_grp --name $con_name --image $con_image --os-type Linux --location $loc --restart-policy Always --ip-address Public --ports 3000 --dns-name-label $con_dns_name
- Let's go see if it worked. In the JSON returned you'll see a attribute called "fqdn". Copy that and paste it into your browser like "http://thefqdn:3000/"

- If its up and running you'll get an initial log screen. The default UserID is 'admin' and the Password is 'admin'. Go ahead and log in and change the password to something else.

- So we're all done right? Not quite. Let's restart the container and see what happens.
az container restart --name $con_name --resource-group $resource_grp - Go back to your web browser and refresh. Not working? Try the default password again ... that works?

What's happening is that containers are stateless. Every time they restart its a fresh image. By default Grafana keeps all its configuration on the local file system so its wiped out. We need to make some changes so we get to keep our state, configurations, data, etc. - Go ahead and stop your container for now
az container stop --name $con_name --resource-group $resource_grp
We need to now create an MySQL DB and container variables to maintain the state of our Grafana instance. We'll be working from the Azure Cloud Shell again.
A bit of background on how container variables are handled. Grafana allows for configuration parameters to be overridden by using environmental variables. This is well documented in the Grafana docs, you can dive deeper if you want here. What we want to do is set the new environment variables in the Azure Container configuration.
Azure Containers have 4 ways to hold persistent configuration data, we'll be using 2 of them now.
- Environment Variables: plain text set at the container OS level. We'll put non-sensitive config items here.
- Secure Environment Variables: masked values. We'll put our DB connection string info here.
Let's go ahead and provision the MySQL DB.
- In the Azure Cloud Shell we need to add an extension to the AZ CLI which will make this really easy ... it's called db-up.
az extension add --name db-up - Now let's add a few more shell variables
db_server_name="[your initials]-grafanasql"
db_admin_name="sqladmin"
db_name="grafana" - Now let's create the MySQL DB
az mysql up --resource-group $resource_grp --location $loc --server-name $db_server_name --sku-name B_Gen5_1 --backup-retention 7 --storage-size 5120 --admin-user $db_admin_name --admin-password "youputsomethinghere" - Now let's grab the db servers FQDN as we'll need this to connect to the host.
db_server_fqdn="$(az mysql server show --resource-group $resource_grp --name $db_server_name --query"fullyQualifiedDomainName" --output tsv)" - Now lets connect to the MySQL host and create the DB we need.
mysql -h $db_server_fqdn -u $db_admin_name@$db_server_name -p -e "CREATE DATABASE $db_name;"
Let's doublecheck our work by asking for a list of database
mysql -h $db_server_fqdn -u $db_admin_name@$db_server_name -p -e "SHOW DATABASES;"
Now we need to configure Grafana using the ACI environment and secure variable's.
- This command will override the existing configuration for the container which is what we want. No need to delete and recreate.
Note that non-sensitive items are items coming after "--environment-variables" and things like host name, DB type, etc.
Sensitive items come after "--secure-environment-variables" and include the database userID and password.
az container create --resource-group $resource_grp --name $con_name --image $con_image --os-type Linux --location $loc --restart-policy Always --ip-address Public --ports 3000 --dns-name-label $con_dns_name \
--environment-variables \
"GF_DATABASE_TYPE=mysql" \
"GF_DATABASE_HOST=$db_server_fqdn:3306" "GF_DATABASE_SSL_MODE=true" "GF_DATABASE_CA_CERT_PATH=/etc/ssl/certs/ca-cert-Baltimore_CyberTrust_Root.pem" "GF_DATABASE_SERVER_CERT_NAME=*.mysql.database.azure.com" \
--secure-environment-variables "GF_DATABASE_USER=$db_admin_name@$db_server_name" "GF_DATABASE_PASSWORD=[putyourpasswordhere]" - After this command completes let's check our work by pulling the logs from the container.
az container logs --resource-group $resource_grp --name $con_name
Note that you'll see items that show "Config overridden ..." that is just that and "Executing migration" shows the guts of the database are being created on the fly (one time init for new DBs driven by Grafana). Also check out the fact that the database field is masked.
Another way we can check our work is by querying the environment variables.
az container show --resource-group $resource_grp --name $con_name --query containers[0].environmentVariables
Ok, last step ... do we have a stateful Grafana instance?
- Let's go back to our web browser and see if we can login and reset the admin password. Remember the default User ID is 'admin' and the password is 'admin'. Log in and change it.
- You should see the "Welcome to Grafana" default dashboard. Let's make a small change to it. Click on "Remove this panel" and it should disappear.

- Now let's restart the container to see if everything is working.
az container restart --resource-group $resource_grp --name $con_name
When you go back to your web browser you shouldn't have to authenticate again because there's still a session cookie that has persisted. You'll note that the change you made to the default dashboard is as we expect it.
🚀🚀 Mission Accomplished!!! 🚀🚀
Not quite a moon landing yet you did it! You have a stateful Grafana sandbox that is server-less running in the cloud.
Now, wouldn't it be cool if you could automate this and spin up a new instance in less than 10 minutes? Well I've got you covered there too with a quick start that you can clone and build on. Check out my GitHub repo for a GitHub Actions workflow!

Before We Go ... Considerations for Using this in Production
PLEASE make sure you have a plan when moving out of your sandbox. These are items that I've addressed and have experience deploying for a true enterprise-ready solution. So take my word you need to consider these!
PLEASE make sure you have a plan when moving out of your sandbox. These are items that I've addressed and have experience deploying for a true enterprise-ready solution. So take my word you need to consider these!
- The current config does not have an SSL certificate applied which means there is no encryption in transit. This can be added in the Grafana configuration.
- Additional credentials should be created for the MySQL host so that least privilege access can be maintained.
- The capacity settings for compute, memory, and storage are set to bare minimum. Validate which SKU's are the right fit. Grafana is very reasonable on resource usage so don't go crazy.
- Grafana supports SAML and OAuth, you should consider leveraging your existing enterprise directory/auth platform.
- Grafana scales out well. You'd need to consider using additional Azure features to address load balancing and orchestration.